
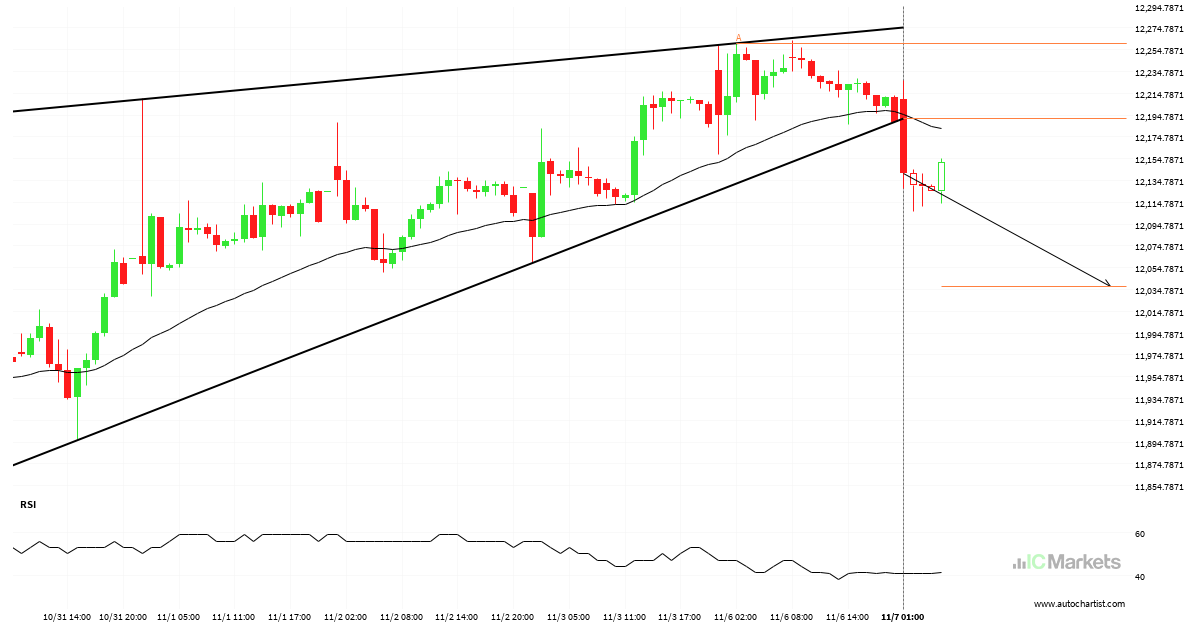
FTSE China A50 Index – support line broken at 2023-11-07T02:00:00.000Z
FTSE China A50 Index has broken through a support line of a Rising Wedge and suggests a possible movement to 12037.7793 within the next 2 days. It has tested this line in the past, so one should probably wait for a confirmation of this breakout before taking action. If the breakout doesn’t confirm, we could […]

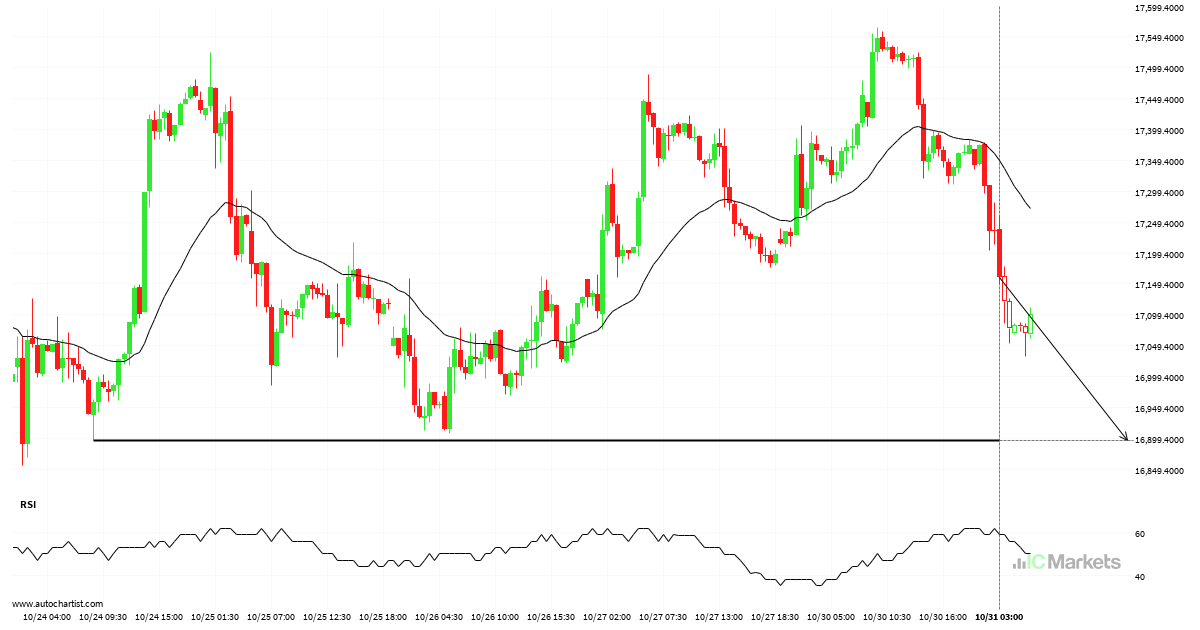
Hong Kong 50 Index experienced an exceptionally large movement
Hong Kong 50 Index has experiened an extremely big movement in last 4 days. It may continue the trend, but this would make the move unprecidented in the recent past.
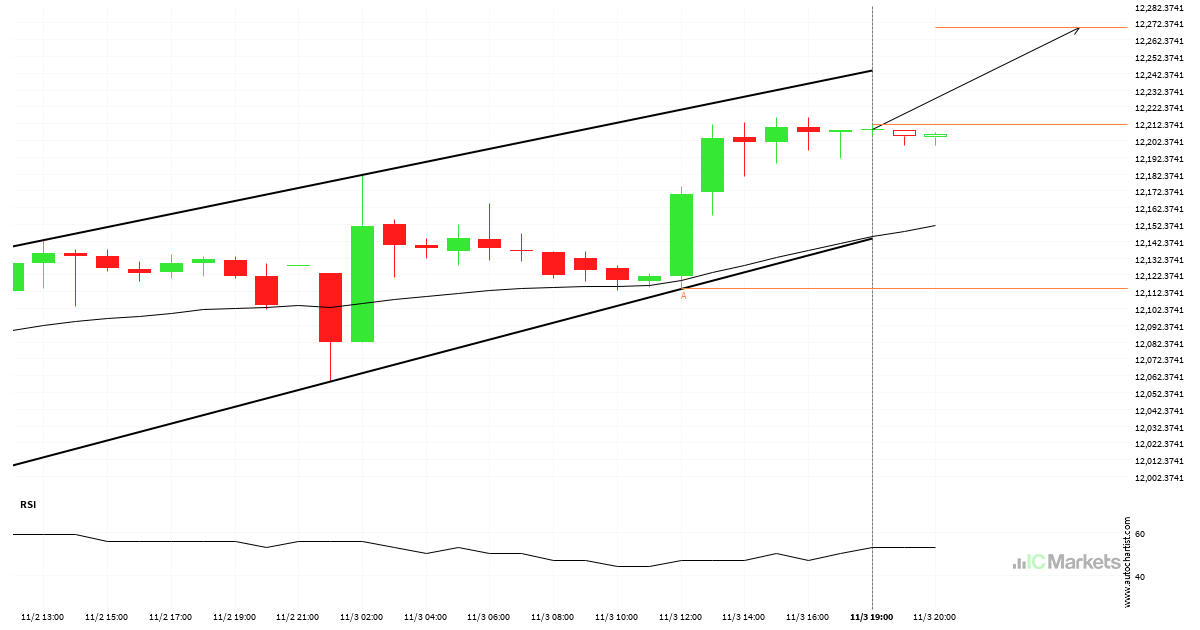
FTSE China A50 Index – Continuation Chart Pattern – Channel Up
FTSE China A50 Index was identified at around 12212.13 having recently rebounded of the support on the 1 hour data interval. Ultimately, the price action of the stock has formed a Channel Up pattern. This squeeze may increases the chances of a strong breakout. The projected movement will potentially take the price to around the […]
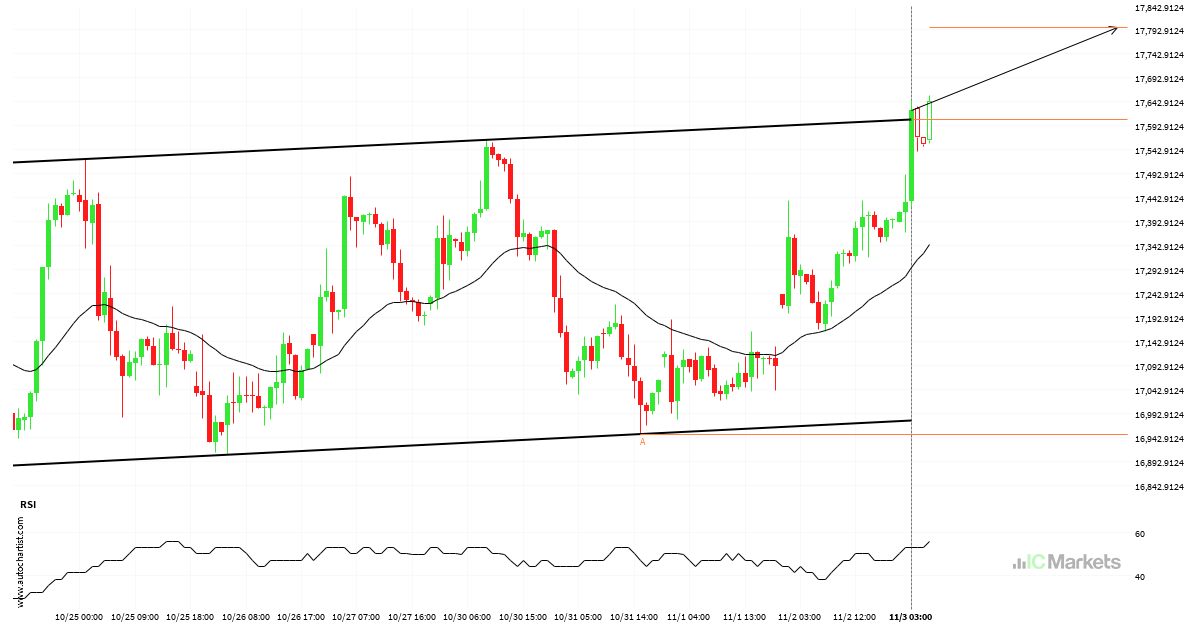
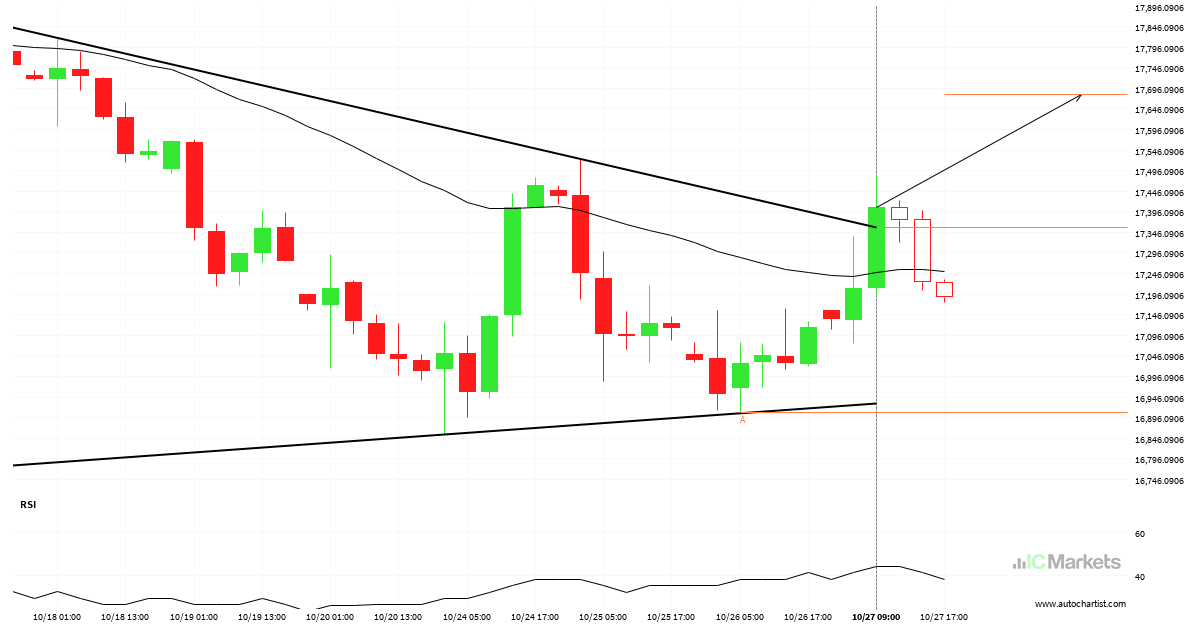
Continuation pattern on Hong Kong 50 Index
Hong Kong 50 Index has broken through a resistance line of a Rectangle chart pattern. If this breakout holds true, we may see the price of Hong Kong 50 Index testing 17797.3118 within the next 2 days. But don’t be so quick to trade, it has tested this line in the past, so you should […]
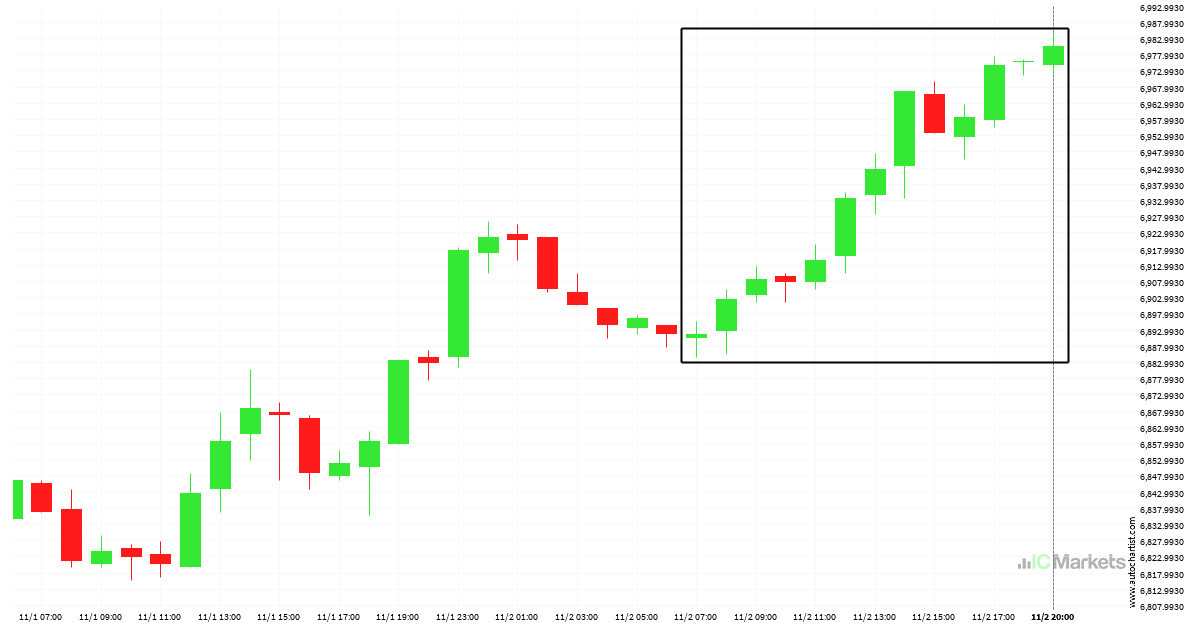
Australia 200 Index was on its way up
Australia 200 Index has moved higher by 1.29% from 6891.55 to 6980.55 in the last 13 hours.
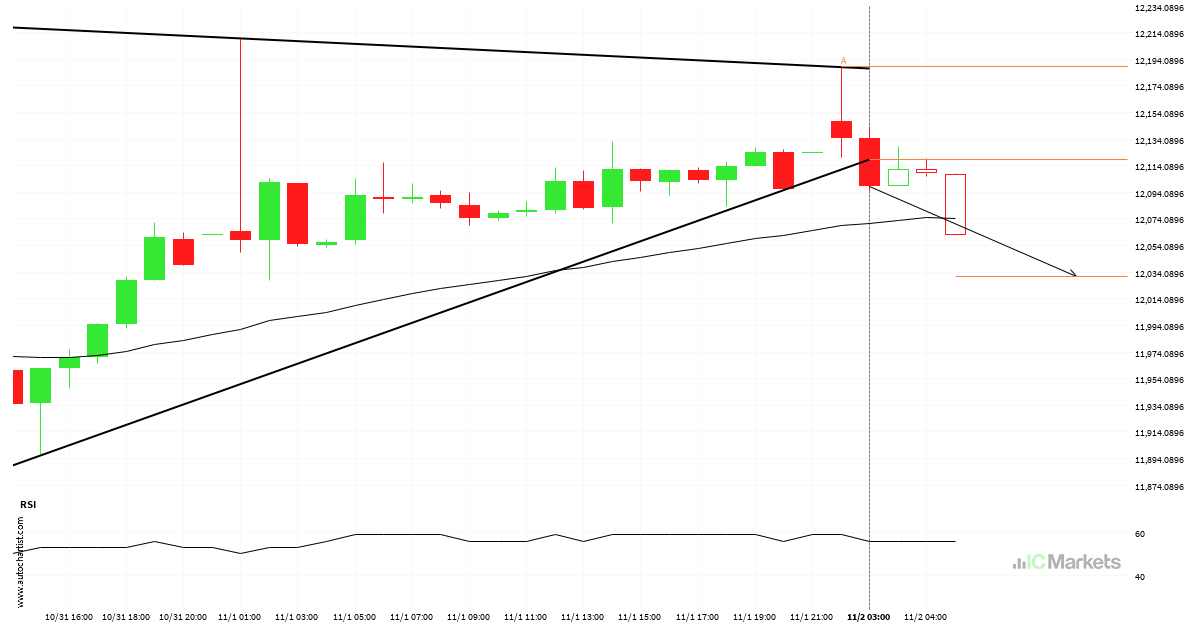
FTSE China A50 Index has broken through support
The last 2 1 hour candles on FTSE China A50 Index formed a Triangle pattern and broken out through the pattern lines, indicating a possible bearish movement towards the price level of 12031.2210.
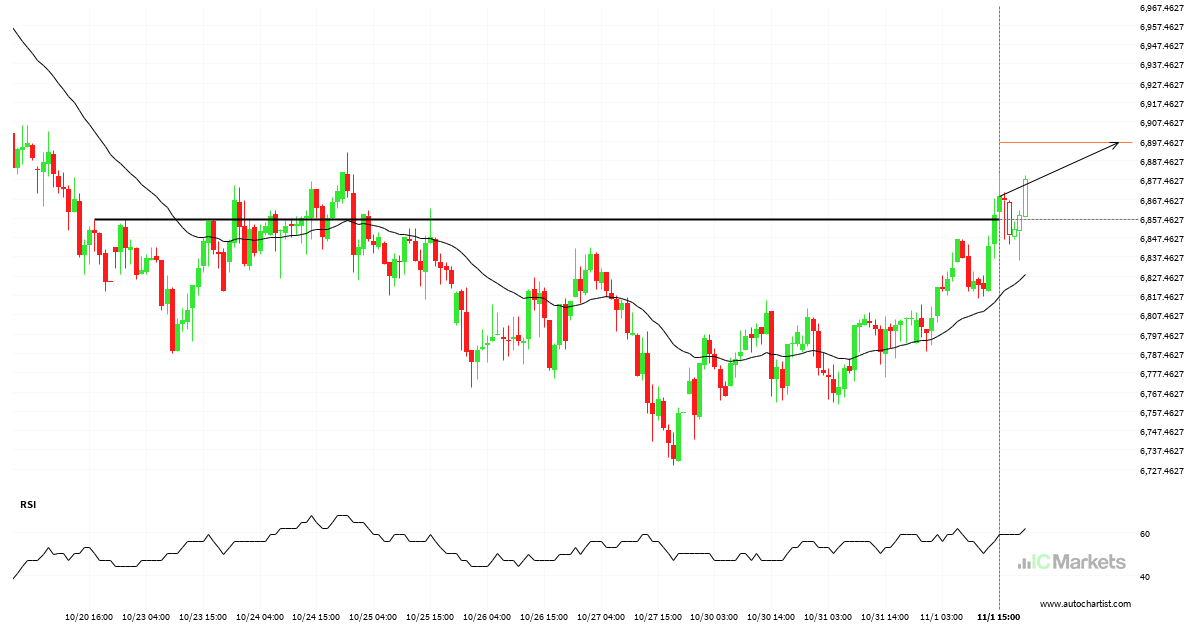
Possible start of a bullish trend on Australia 200 Index
Australia 200 Index has broken through a resistance line. Because we have seen it retrace from this price in the past, one should wait for confirmation of the breakout before trading. It has touched this line numerous times in the last 12 days and suggests a possible target level to be around 6896.5088 within the […]
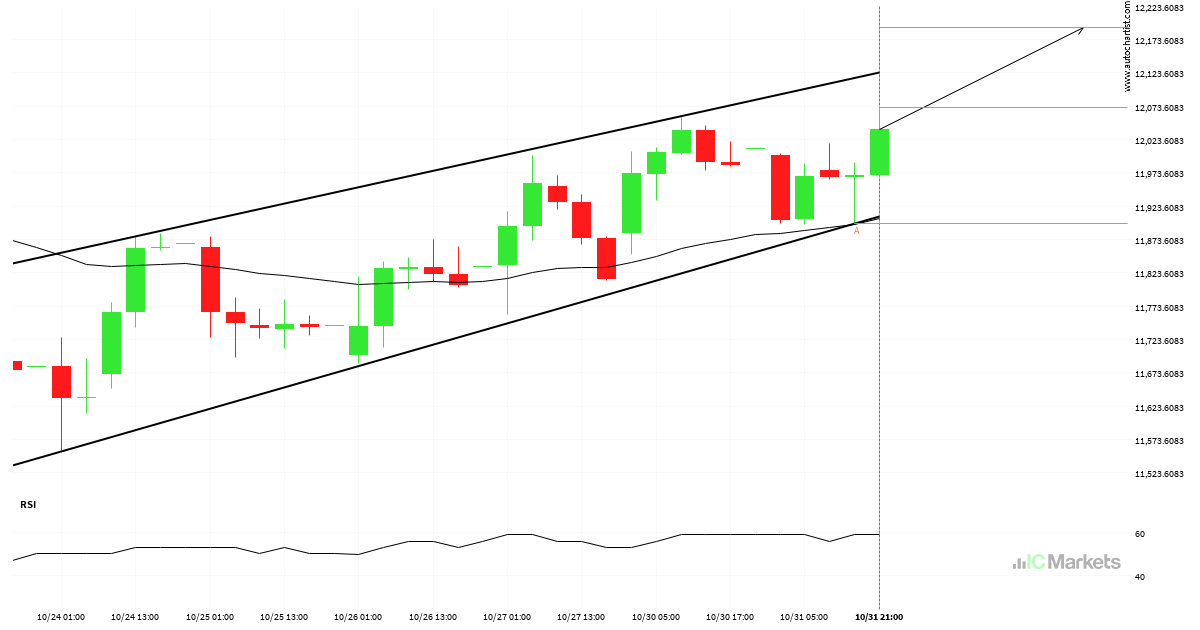
Will FTSE China A50 Index have enough momentum to break resistance?
FTSE China A50 Index was identified at around 12071.81 having recently rebounded of the support on the 4 hour data interval. Ultimately, the price action of the stock has formed a Channel Up pattern. This squeeze may increases the chances of a strong breakout. The projected movement will potentially take the price to around the […]
Hong Kong 50 Index – getting close to psychological price line
Hong Kong 50 Index is moving towards a support line. Because we have seen it retrace from this level in the past, we could see either a break through this line, or a rebound back to current levels. It has touched this line numerous times in the last 7 days and may test it again […]
Hong Kong 50 Index has broken through resistance
Hong Kong 50 Index has broken through a resistance line. It has touched this line at least twice in the last 15 days. This breakout may indicate a potential move to 17680.3395 within the next 2 days. Because we have seen it retrace from this position in the past, one should wait for confirmation of […]